plotIt
plotIt is a utility to plot ROOT histogram stacks. The input files corresponding to the different contributions and the histograms to fit are configured through a yaml file.
First time setup instructions
git clone -o upstream https://github.com/cp3-llbb/plotIt.git # inside $CMSSW_BASE/src/cp3_llbb
cd plotIt/

# Initialize the git remotes
source firstsetup.sh
# Within-CMSSW and on ingrid specific install
cms_env # specific to ingrid, aka 'module purge; module load grid/grid_environment_sl6; module load crab/crab3; module load cms/cmssw;'
cmsenv
source setup_for_cms_env.sh
# For a non-CMSSW and non-ingrid install (beware there is no cmsenv at all in this case):
# source setup_sl6_env.sh

# Build externals
cd external
./build-external.sh
# Build the executable itself
cd ..
make -j 4
Outside CMSSW and with a recent version of ROOT, plotIt can als be built with CMake (and an install prefix passed with -DCMAKE_INSTALL_PREFIX, or the exectuble copied from the build directory to install), e.g.
git clone -o upstream https://github.com/cp3-llbb/plotIt.git
mkdir plotit-build
cd plotit-build
cmake ../plotIt
make -j2
cd -
Test run (command line)
# Load the proper environment (if not already done)
source setup_sl6_env.sh
# Create some dumb root files to play with
cd test
root -l -b -q generate_files.C
# Now plot stuff
./../plotIt -o plots/ example.yml
# Go to the plots directory to observe the beautiful plots
Optional command-line arguments
The command above is the minimal way to run plotIt: with a configuration file and output directory. There are also a number of optional arguments that change the behaviour:
-h: print help for the command-line interface and exit-v: verbose output, will print more progress messages, a summary, and the LaTeX yields table (if-yis also specified) to stdout-b: print systematics details for each MC process in the summary-o: output directory-i: input directory (file names are taken relative to this directory, default is the current directory)-y: produce a yields table (written to<output>/yields.tex)-p: do not produce the plots--ignore-scales: ignore (global and per-file)scaleparameters for the normalisation-e: pass one era to make plots for (otherwise combined plots, summing over all eras specified in the configuration, are made)-u: unblind, i.e. ignore any blinded-range in the configuration
Configuration file reference
Points andRanges are lists of two numbers:[x,y]Positions are lists of four numbers:[x1, y1, x2, y2]- Some strings are formatted using boost::format. Arguments passed to the formatting are described below.
- Strings used for labels, axis titles, legends, ... can use TLatex
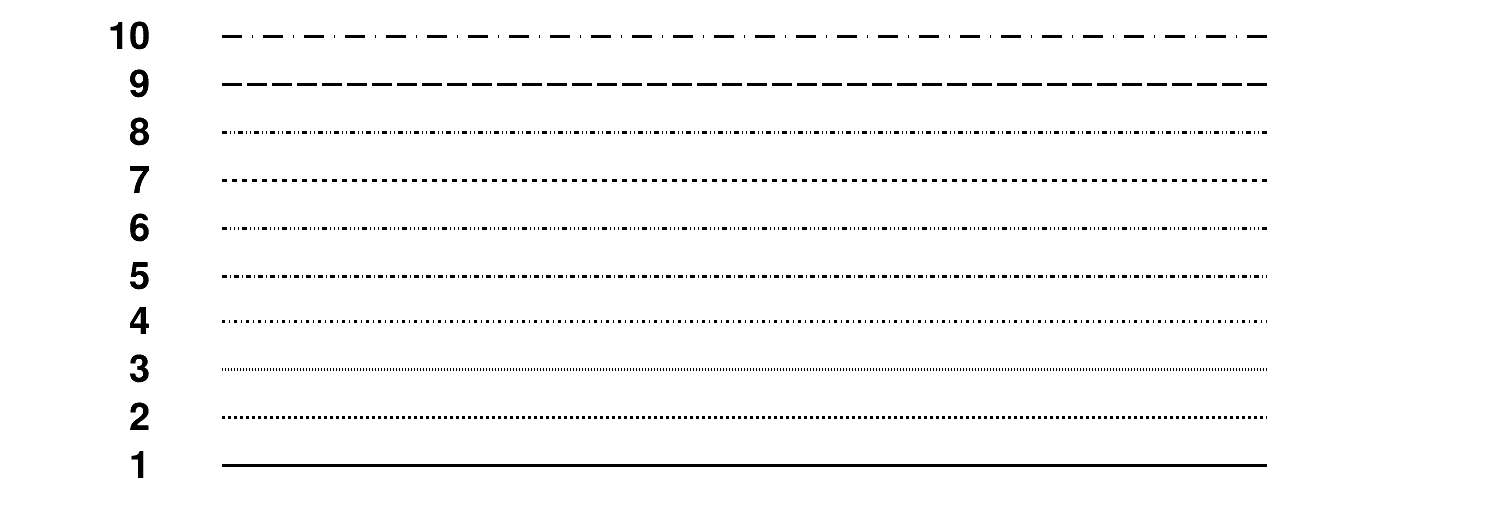
- Line styles and widths, fill styles and marker styles are numbers, see the corresponding
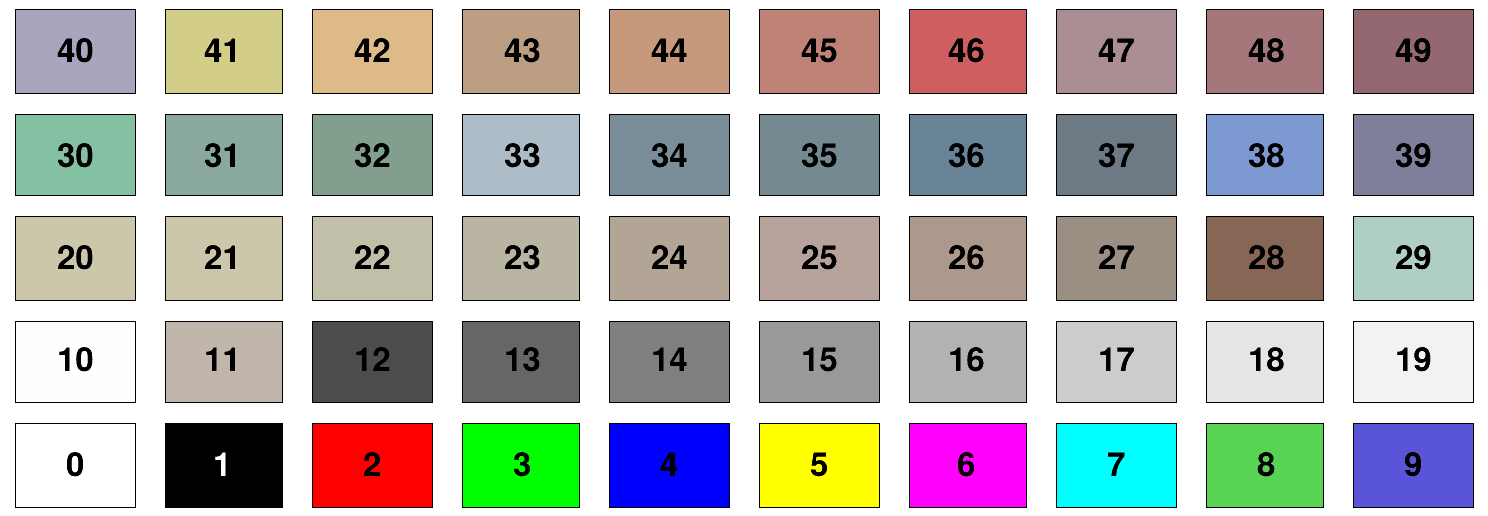
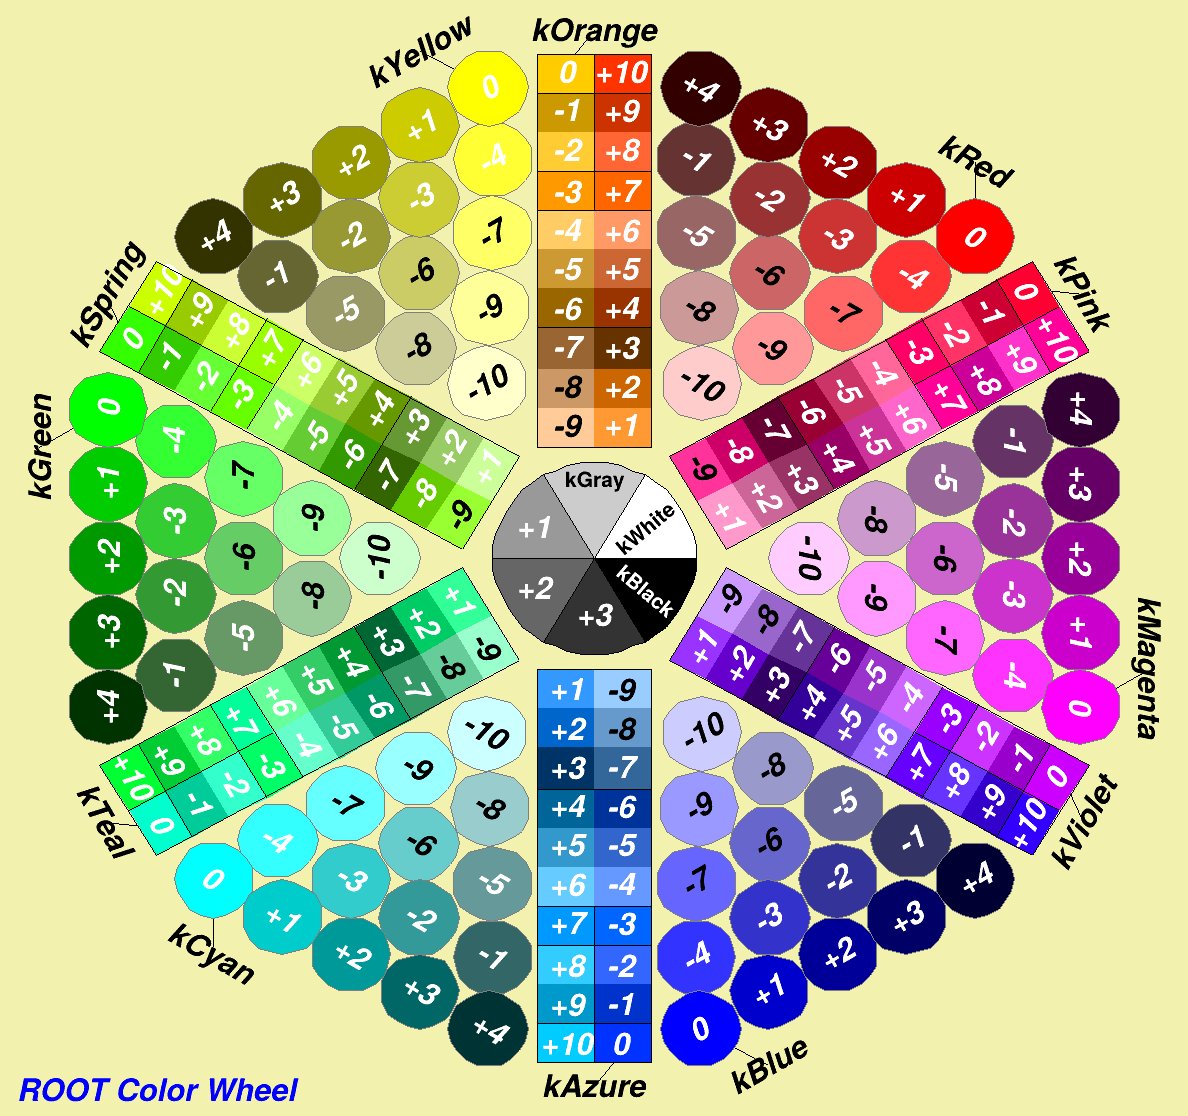
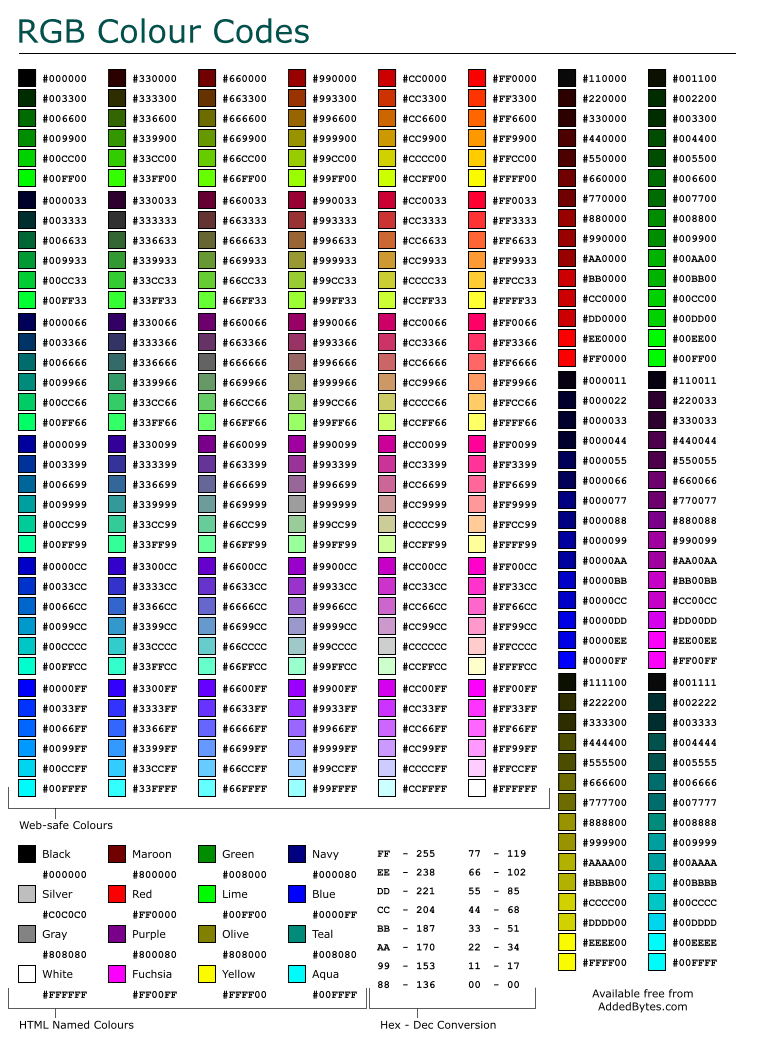
TAtt...class references or the lists below for some common values - Colors are either basic ROOT colors (ie 42) or hexadecimal (alpha)RGB (ie #FFFFCC)
plotIt general ('configuration')
| Field | Type | Action | Default |
|---|---|---|---|
| width | number | Width (in pixels) of the plots | 800 |
| height | number | Height (in pixels) of the plots | 800 |
| experiment | string | Name of the experiment, appearing in bold above the plot | CMS |
| extra-label | string | Additional text above the plot | |
| root | string | Path to the folder where the files are located | ./ |
| scale | number | Global scaling of all non-data entries | 1 |
| eras | list of strings | List of data-taking periods to combine | [""] |
| luminosity | number or map | Integrated luminosity (in pb) used to normalise MC to data. Used by the luminosity label. When using eras: map of { era : luminosity } |
|
| luminosity-error | number | Fractional uncertainty on the integrated luminosity. Used for the yields table (uncertainty on MC and data/MC ratio) and the plot's MC & ratio syst. error bands. | 0 |
| luminosity-label | string | Luminosity label appearing above the plot. In the string, %lumi% gets replaced by the integrated luminosity in fb. |
|
| error-fill-color | color | 42 |
|
| error-fill-style | fill style | 3154 |
|
| fit-line-color | color | 46 |
|
| fit-line-style | line style | 1 |
|
| fit-line-width | line width | 1 |
|
| fit-error-fill-color | color | 42 |
|
| fit-error-fill-style | fill style | 1001 |
|
| fit-n-points | number | 1000 |
|
| ratio-fit-line-color | color | 46 |
|
| ratio-fit-line-style | line style | 1 |
|
| ratio-fit-line-width | line width | 1 |
|
| ratio-fit-error-fill-color | color | 42 |
|
| ratio-fit-error-fill-style | fill style | 1001 |
|
| ratio-fit-n-points | number | 1000 |
|
| blinded-range-fill-color | color | 42 |
|
| blinded-range-fill-style | fill style | 1001 |
|
| y-axis-format | formatted string | Arg. 1: plot's y-axis title; Arg. 2: plot's first bin's width | %1% / %2$.2f |
| ratio-y-axis | string | Y axis title of the ratio plot | Data / MC |
| ratio-style | string | Draw option for the ratio histogram | P0 |
| mode | string | tree (fill TH1s from a tree on-the-fly) or hist (retrieve TH1s from files) |
hist |
| tree-name | string | Name of the TTree used to fill the histograms in tree mode |
|
| labels | Label | Extra labels' configurations (see below). | |
| show-overflow | bool | Show under- and overflow | false |
| errors-type | string | normal (ie. sqrt(N)), poisson (68% Poisson interval) or poisson2 |
poisson |
| yields-table-stretch | number | Stretch of LaTeX table produced | 1.15 |
| yields-table-align | string | Alignment of the LaTeX table. For now only h (processes horizontal, categories vertical) is supported. |
h |
| yields-table-text-align | string | l/r/c: alignment of text in the LaTeX table's entries. |
c |
| yields-table-numerical-precision-yields | number | Number of decimals used for the MC yields in the LaTeX table. | 1 |
| yields-table-numerical-precision-ratio | number | Number of decimals used for the data/MC ratio in the LaTeX table. | 2 |
| line-color | color | Default color of lines | 1 |
| line-type | line style | Default style (type) of lines | 1 |
| line-width | number | Default width of lines | 1 |
| book-keeping-file | string | If set, store all the produced plots into this file in addition to create graphic files | none |
| x-axis-label-size | number | The size of the labels on the x-axis, in pixel | 18 |
| y-axis-label-size | number | The size of the labels on the y-axis, in pixel | 18 |
| x-axis-top-ticks | bool | Show ticks at the top of the frame | True |
| y-axis-right-ticks | bool | Show ticks at the right of the frame | True |
| transparent-background | bool | Transparent background for canvas and legend | False |
Plots configuration ('plots')
| Field | Type | Action | Default |
|---|---|---|---|
| exclude | string | Regexp allowing to exlude histograms present in the files whose name matches the plot's name | |
| x-axis | string | x-axis title | |
| y-axis | string | y-axis title | Events |
| y-axis-format | formatted string | Overrides plotIt option. | %1% |
| normalized | bool | Normalize data/each signal/total MC to 1. | false |
| normalizedByBinWidth | bool | The bin contents and errors are divided by the bin width. | false |
| no-data | bool | Do not plot data. | false |
| override | bool | If any plot has this field set to true, only plots which do will be produced. | false |
| log-y | bool | Log-scale on y-axis. Special value: Both. |
false |
| log-x | bool | Log-scale on x-axis. Special value: Both. |
false |
| save-extensions | list of strings | Write plot to file in each of this formats (supported by TCanvas::Print()) |
[pdf] |
| show-ratio | bool | Show ratio plot under main plot. | false |
| fit | bool | Do a fit | false |
| fit-function | string | Function used for the fit. | gaus |
| fit-legend | formatted string | Fit results. Arg. i: fitted parameter i. | #scale[1.6]{#splitline{#mu = %2$.3f}{#sigma = %3$.3f}} |
| fit-legend-position | Point | Position of the fit results | [0.22, 0.87] |
| fit-range | Range | Restrict fit to this range | |
| fit-ratio | bool | Fit the ratio plot | false |
| ratio-fit-function | string | Function used for the ratio fit. | pol1 |
| ratio-fit-legend | formatted string | Ratio fit results. Arg. i: fitted parameter i. | |
| ratio-fit-legend-position | Point | Position of the ratio fit results | [0.20, 0.38] |
| ratio-fit-range | Range | Restrict ratio fit to this range | |
| show-errors | bool | Show errors on data points. | true |
| x-axis-range | Range | Range of x-axis. | TH1's range |
| log-x-axis-range | Range | Range of x-axis to be applied only if the x axis is in log scale. | Same as x-axis-range |
| y-axis-range | Range | Range of y-axis. | Computed from each TH1's range |
| log-y-axis-range | Range | Range of y-axis to be applied only if the y axis is in log scale. | Same as y-axis-range |
| ratio-y-axis-range | Range | Range of y-axis for ratio | [0.5, 1.5] |
| blinded-range | Range | Blind a range of data in the plot. Note that the bins that include the values used to specify the range will be blinded, and that the left edge is included in a bin (so you may have to write 4.9999 to blind up to 5, itself excluded). | |
| y-axis-show-zero | bool | Force y-axis range to go down to zero (might not be the case for flat distributions). | false |
| inherits-from | string | TH1 |
|
| rebin | number | Rebin: merge x bins into one |
1 |
| labels | Label | Extra labels' configurations (see below). | |
| extra-label | string | ||
| legend-position | Position | Overrides plotIt option. | |
| legend-columns | number | Overrides plotIt option. | |
| show-overflow | bool | Overrides plotIt option. | |
| errors-type | string | Overrides plotIt option. | |
| binning-x | number | ||
| binning-y | number | ||
| draw-string | string | In tree mode, formula used to fill the histogram |
|
| selection-string | string | In tree mode, formula used to select events when filling histogram |
|
| for-yields | bool | Plot defines an entry as a category in the LaTeX yields table. | false |
| yields-title | string | Name of the category in the table. Must be valid LaTeX text string! | plot's name |
| yields-table-order | number | Order of appearance of the category in the yields table (small=up). | 0 |
| vertical-lines | Line | Draw vertical lines on the plot | Empty |
| horizontal-lines | Line | Draw horizontal lines on the plot | Empty |
| lines | Line | Draw arbitrary lines on the plot | Empty |
| rename | List of renaming operations | Apply a set of renaming operations to the output filename | |
| sort-by-yields | bool | If true, histograms inside a given stack are sorted by yields, the smallest one at the bottom of the stack. This is the default behavior. Set to false to disable. |
true |
| x-axis-label-size | number | The size of the labels on the x-axis, in pixel | Value of x-axis-label-size of the main configuration |
| y-axis-label-size | number | The size of the labels on the y-axis, in pixel | Value of y-axis-label-size of the main configuration |
| x-axis-hide-ticks | bool | Hide ticks on the x axis |
False |
| y-axis-hide-ticks | bool | Hide ticks on the y axis |
False |
| ratio-y-axis | string | Y axis title of the ratio plot | Value of ratio-y-axis of the main configuration |
Files configuration ('files')
Each MC contribution is scaled by plotIt.scale*<luminosity>*scale*cross-section*branching-ratio/generated-events,
where <luminosity> is the luminosity for the era of the file, or the total luminosity if no era is specified.
| Field | Type | Action | Default |
|---|---|---|---|
| type | string | data, mc (all MC are stacked based on their stack-index) or signal (not stacked) |
mc |
| scale | number | Scale this contribution | 1 |
| cross-section | number | Cross-section of the process | 1 |
| branching-ratio | number | Branching ratio of the process | 1 |
| generated-events | number | Careful! Sum of generated event weights! Can be different from the number of generated events. | 1 |
| era | string | era (used to select the corresponding integrated luminosity value for normalisation of MC, when using eras) | |
| order | number | Order in which the histograms are stacked (concerns MC only). Small=low. | |
| legend | string | Name of the file in the legend, unless group is defined . |
|
| group | Group | Refers to a legend group (see below) | |
| yields-group | string | Used to group contributions in the LaTeX yields table (does't use a "group" node such as the legend groups). | In this order, defaults to group, legend or the file's name. |
| systematics | Systematics | Set of systematics nodes, as defined below. | |
| drawing-options | string | Possibility to override TH1::Draw() option. | hist for signals and MC, P for data. |
| fill-color | color | For this and the following: -1 means that the quantity is not set. |
MC: 1, else: -1 |
| fill-type | fill style | MC: 1001 , signal: 0, else: -1 |
|
| line-color | color | MC: -1, else: 1 |
|
| line-type | line style | signal: 2, else: -1 |
|
| line-width | line width | MC: 0, else: 1 |
|
| marker-color | color | MC & signal: -1, else: 1 |
|
| marker-type | marker style | MC & signal: -1, else: 20 |
|
| marker-size | number | MC & signal: -1, else: 1 |
|
| stack-index | number | Only MC files with the same stack-index are stacked together. Useful to have multiple stacks in the same plot |
0 |
| rename | List of renaming operations | Apply a set of renaming operations to all the histograms loaded from this file. It can be used for example to plot two different histograms from the same input file |
Additional fields
Groups ('groups')
Legend ('legend')
Systematics configuration ('systematics')
Different types of systematic uncertainties are supported: shape, log-normal and constant.
Each shape uncertainty requires an up and down variated histogram. They are retrieved using its name, specified in the yml file as:
systematics:
  - <systematic>
systematics:
  - <systematic>:
     type: shape
<nominal>__<systematic>[up|down], where <nominal> is the nominal histogram, in the file containing all the nominal histograms, or look for histograms called <nominal> in two files called <nominalFile>__<systematic>[up|down].root (where <nominalFile> is the file containing the nominal histograms for that process).
A constant systematic is just a rate uncertainty, which can specified either as:
systematics:
  - <systematic>: <value>
systematics:
  - <systematic>:
     type: const
     value: <value>
<value> is the value with which the nominal histogram should be scaled up and down (by <value> and 2-<value>): e.g. with 1.025, the histograms are scaled by 1.025 and 0.975, i.e. by +/- 2.5%.
Any kind of systematics can be restricted to a subset of files by means of a regular expression:
systematics:
  - <systematic>:
     type: shape
     on: 'ttbar'
<systematic> on files containing ttbar.
When plotting, all uncertainties will be added in quadrature, assuming zero correlations between all of them.
Additional labels ('labels')
Each plot can be assigned a set of labels. A label is a custom string which can be positioned anywhere on the canvas. You can defined labels as follow:
labels:
  - {<label1>}
  - {<label2>}
| Field | Type | Action | Default |
|---|---|---|---|
| text | string | Text of the label. Support TLatex syntax (#splitline{}{} is especially useful for multi-line labels) |
|
| position | Point | Position of the label on the canvas | |
| size | number | Font size of the label (in pixel) | 18 |
Example
plots:
  'Plot':
    x-axis: "X axis"
    y-axis: "Y axis"
    labels:
      - {text: 'Label', position: [0.7, 0.7]}
      - {text: 'Label 2', position: [0.3, 0.7]}
Lines
You can draw lines over a plot using the vertical-lines, horizontal-lines and lines plot options. Each option accepts an array of line. A line is defined:
- By a number for
vertical-linesandhorizontal-lines. In this case, the number represents thexorycoordinate of the line (in plot axis units), and the line will span across all the plot. - By an
arrayof 2Points forlines, where thePoints represent respectively the start point and the end point of the line.
Note
in lines definition, you can use the special value .nan for a point coordinate. This value will automatically be replaced by the maximum or minimum of the x or y axis, depending on which place it's used.
In addition, styling can be applied to lines either globally in the configuration part, or individually for each line.
- In global configuration, you can set the
line-color,line-widthandline-typeoptions. This will affect all lines. - If you want to change the style individually, then you must convert the
linedefinition into amap. Thevaluekey will hold the previous line definition (ie, either a number or anarrayof 2Points), and you can set theline-color,line-widthandline-typeas you would do in the global configuration.
If you want a specific line to be drawn on the ratio instead of the main plot, you can set the pad option to bottom (it defaults to top).
Example
plots:
  'histo1':
    # Draw two vertical lines at x = 3 and x = 7. The first line is stylized individually and drawn on the ratio
    vertical-lines:
      - {
          line-color: 10,
          line-type: 4,
          pad: bottom,
          value: 3
        },
      - 7
    # Draw one horizontal line at y = 80
    horizontal-lines:
      - 80
    # Draw:
    # 1 line from (3, 20) -> (8, 90)
    # 1 vertical line at x = 5 (.nan is replaced automatically by the minimum and maximum of the y-axis)
    lines:
      - [[3, 20], [8, 90]]
      - [[5, .nan], [5, .nan]]
Renaming operations
A renaming operation is defined in YAML as a dictionary with the keys from and to. from is a regular expression following the extended POSIX syntax. Any string matching this regular expression will be replaced by to. Matching groups are supported and can be accessed using the \N syntax, where N is the index of the matching group.
The rename option expect a list of operation. Renaming operations are applied in sequence, starting from the first occurrence.
Example
files:
    'file.root':
        rename:
            - from: '([[:alpha:]+)_cut$'
              to: '\1_nocut'
Parameters cheatsheets
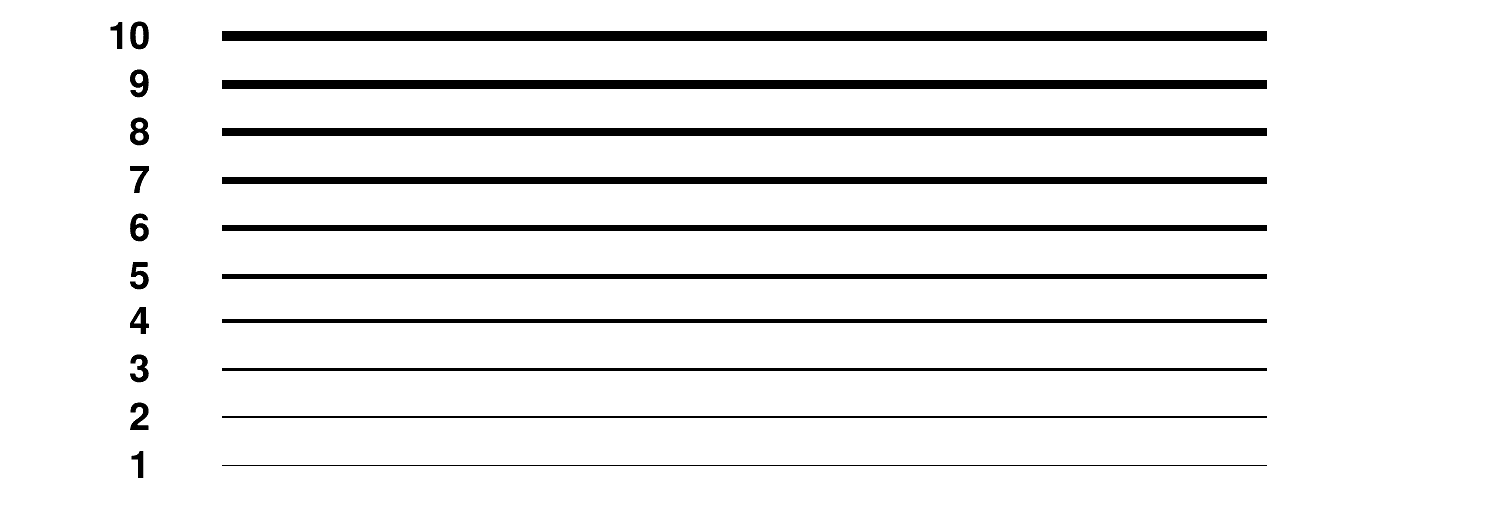
Line styles
Line widths
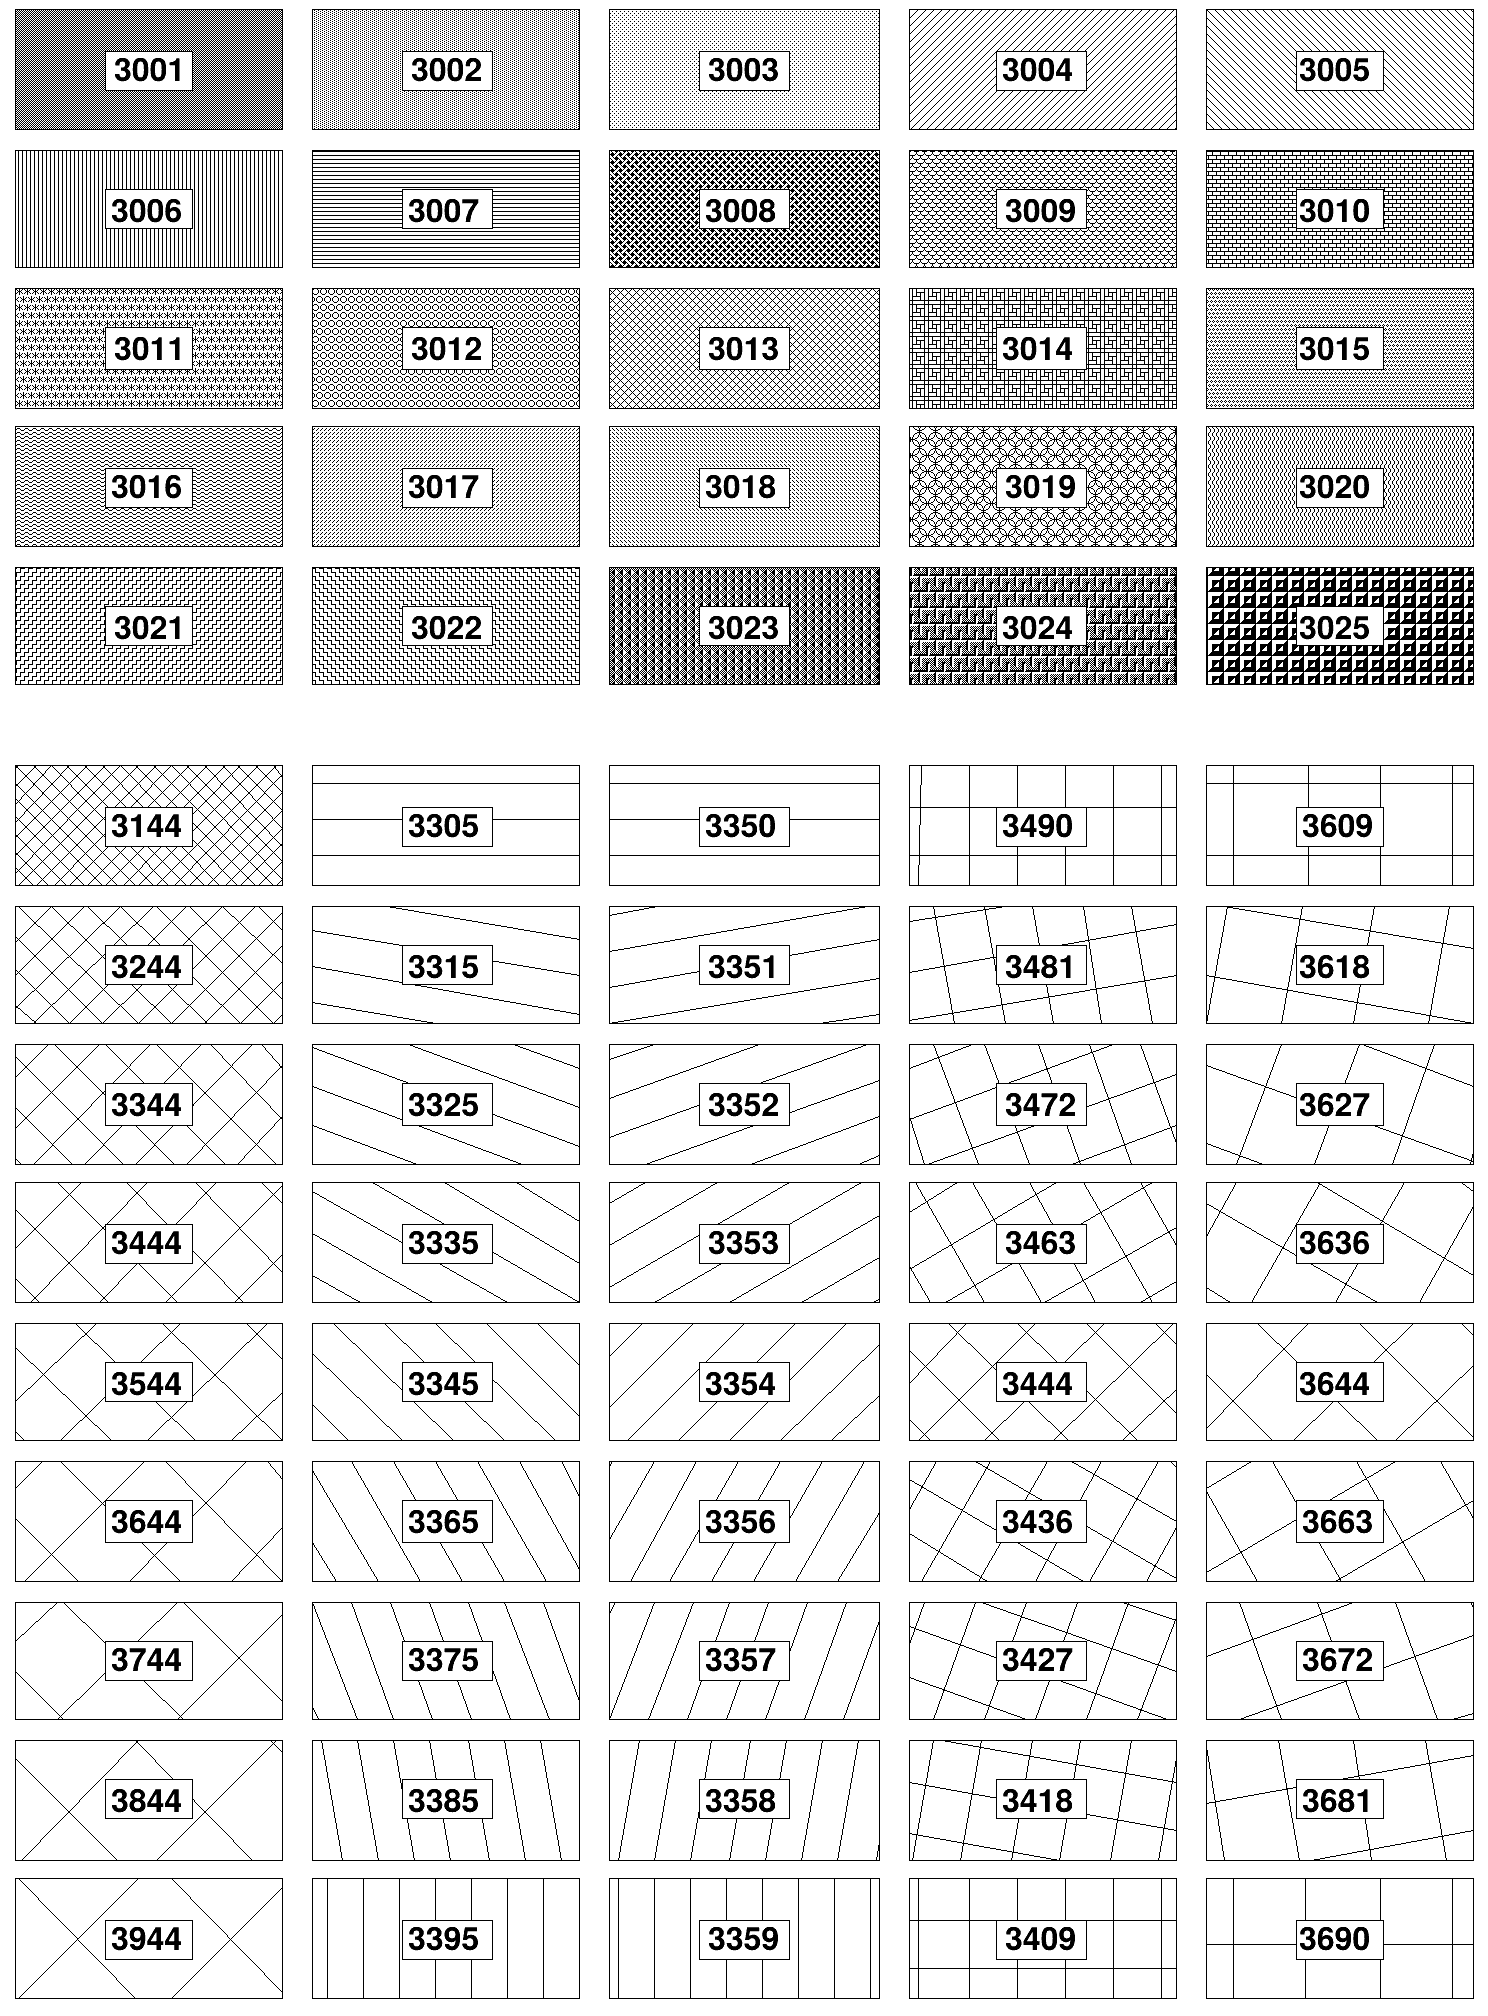
Fill styles
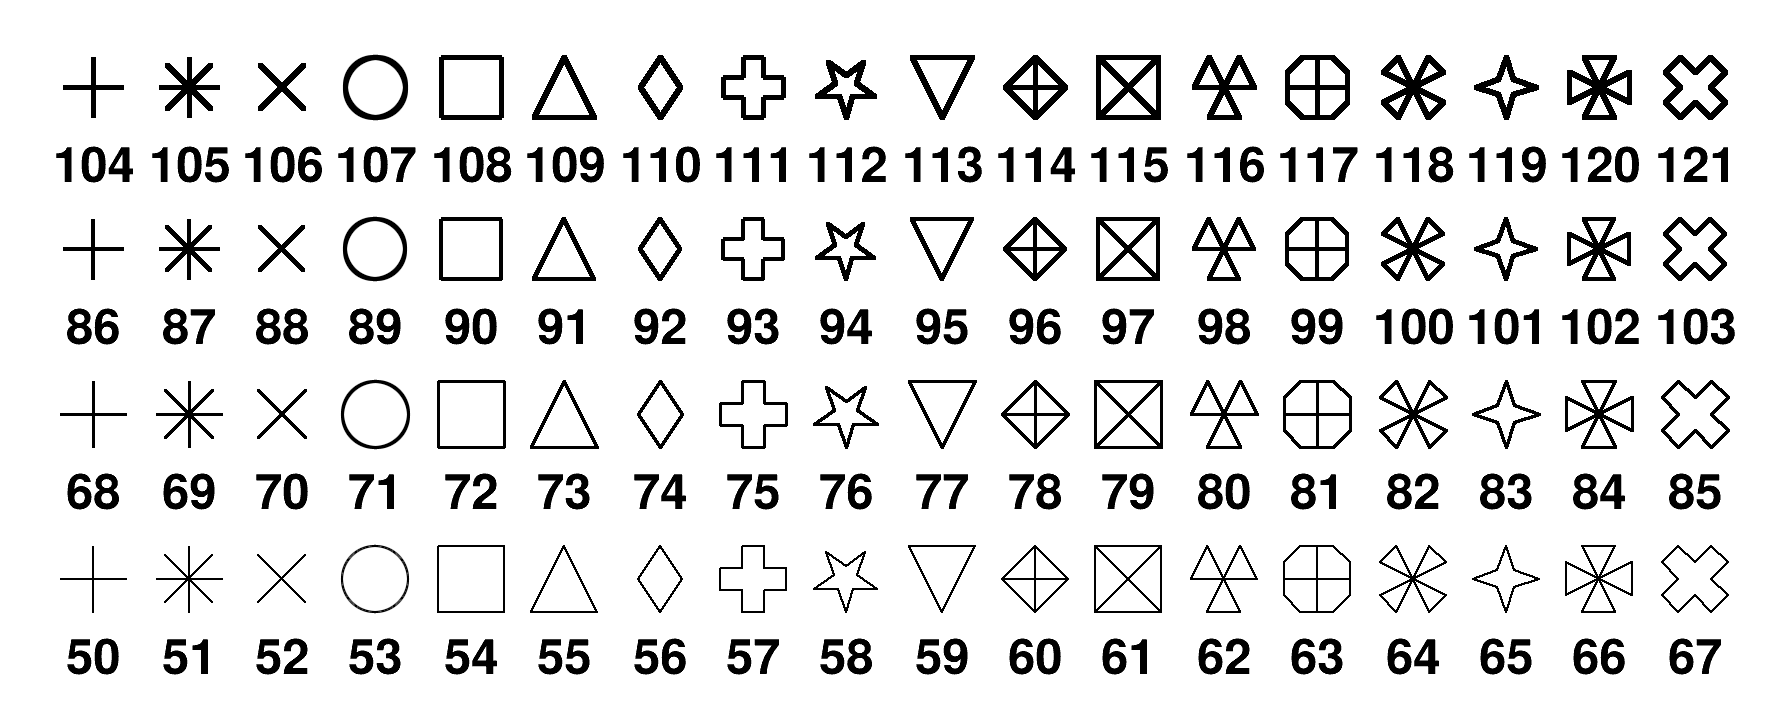
Marker styles

Colors
ROOT basic colors